Stories & Features
Did you miss our live webinar? Watch the replay below, or scroll down for a step-by-step walkthrough from Elizabeth Bernhardt, Ph.D., one of our senior application scientists at IDEX Health & Science.
IDEX Health & Science is an industry leading provider of Semrock hard-coated interference optical filters. Although the following information assumes a general familiarity with hard-coated optical filters, please note we have many great resources on our website to expand your knowledge. In this blog, which is an edited transcript of the webinar, we discuss how to accelerate time to market using the free SearchLight™ spectral modeling tool, our extensive optical filter catalog, and partnering with us.
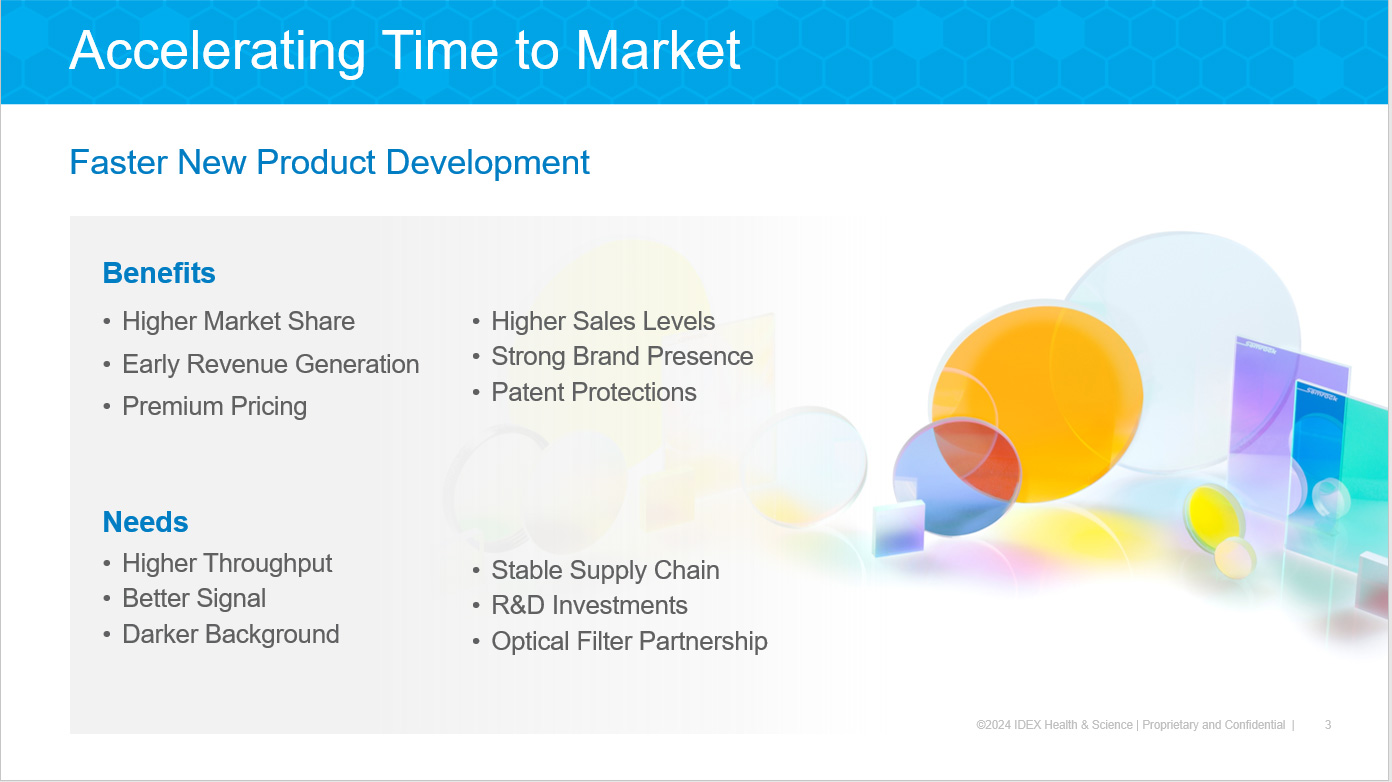
Moving from prototyping to manufacturing in 18 to 24 months or fewer is becoming key to a product’s success. In addition to higher market share and earlier revenue generation, first to market results in premium pricing and higher sales levels. This is particularly true in the life sciences industry, where the rapid adoption of new technologies can drive research and diagnostic capabilities forward. Early market entrants can establish a strong brand presence and become the go-to solution for researchers and clinicians, and patent protections can safeguard innovations and provide a period of market exclusivity. These advantages underscore the importance of rapid development and commercialization strategies in the life sciences sector.
IDEX Health & Science finds many users of life science instruments need higher throughput, better signal, and darker background, which means selecting the right optical filters is key to product success. You need a stable supply chain, smart investment of R&D dollars, and, ultimately, technical collaboration to meet your filter needs. This blog shares some tools and prototyping considerations to meet the demands of accelerating time to market.
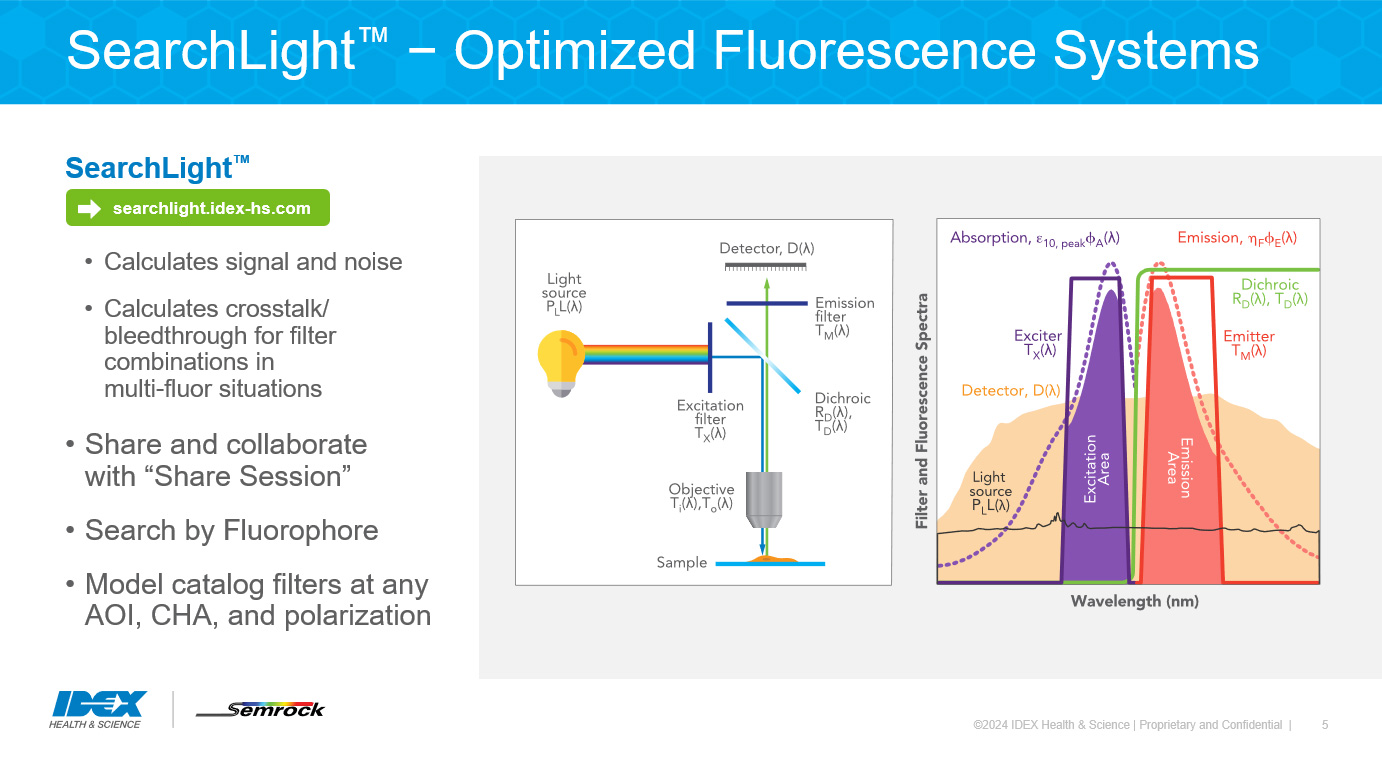
First, let’s consider how to use SearchLight to model your system. This free spectral viewer and analysis tool saves you time avoiding filter optimization at the breadboard level. SearchLight simulates fluorescence setups, enabling you to compare different filters, light sources, and fluorophores. As a note, your data is confidential.
To unlock the full power of SearchLight, create an account, which is a free and easy process. Although you can access SearchLight features without registering, an account will allow you to save and share your SearchLight sessions, upload your own spectral response data, and more.
Bringing filters into your SearchLight session is easy using the “Search” feature. You can search by center wavelength or filter type, and you bring the filter into your session by clicking on the arrow or the part number. If you would like to explore our catalog filters and find a bandpass filter with a center wavelength of 500 nm, type 500 and look through the spectra for a filter of interest. You can also use our naming conventions to explore our catalog. For example, all our dichroics have “Di” in the part number. So, typing “Di” in the search box will bring up all dichroics. The filter search box uses an asterisk as a wild card feature, which is great for expanding searches.
Suppose you found some bandpass filters in your lab, and you would like to find a suitable dichroic. First, bring the filters into your SearchLight session. In this example, the two bandpass filters are FF01-500/24 and FF01-571/72, double click the arrow to bring the filters into the session. We can also adjust the displayed wavelength range by clicking and dragging on the area of interest, or by typing in your desired range. Double clicking on the plot resets the graph to default values.
Which fluorophore are you using in your setup? In this example, let’s use YFP. Search for your fluorophore and double click to bring the fluorophore into the session. Now let’s look at some considerations to determine if these two filters could make a suitable exciter and emitter pair. The passbands overlap with the YFP spectra well enough that we can move to the next step.
Let’s look at the OD blocking, which you can do by clicking the OD radio button. In general, you need deep blocking in the complimentary passband (that is, the exciter should have blocking where the emitter’s passband is and vice versa) and you need the edges of the bandpass filters to be separated in wavelength space. The place where the spectra overlap is called the crossover point. We aim for a crossover point of at least OD3.5, where the spectral response curves overlap at a minimum of OD3.5. In this example, we see these two filters could make a good pair because the complimentary OD blocking is high, and the crossover point is deep.
A filter pair that would not be an optimal choice is using FF01-527/20 as an emitter. We see the crossover point is essentially nonexistent, so there is the potential for light source bleed-through, increased background, etc.
We have determined the two original filters have adequate complimentary OD blocking and OD crossover point, so we can use the compatible products search to find dichroics. First click on the dashed lines next to the YFP fluorophore. Then click on find compatible products. You can search for exciters, emitters, dichroics, and sets. We would like to find a dichroic. The search has found several potential matches, so let’s bring a few into the session.
We typically look for a dichroic that has suitable reflection and transmission bands, and a dichroic edge that is not too close to the exciter and the emitter. Visually comparing the dichroics can provide insight into how the custom set may perform, but SearchLight has an additional important feature: the system calculator. Using this calculator, you can model the signal and noise in the system. It is easy to fill in the different inputs and model the system. To interpret the results, signal relates to brightness, excitation light noise relates to background darkness, and SNR (signal-to-noise ratio) relates to contrast.
Browse through the different dichroics in the calculator to see which set has the brightest signal, darkest background, or best signal to noise ratio. Notice a few inputs could be customized to better model your system: the light source and the camera.
We can search for these spectral responses in Searchlight, either by directly searching for the name of your light source or by looking through the options to find the closest match Let’s use this light source: M505L3. You can also search through the detectors to find the detector you are using or find the closest match. Let’s use this camera: TVISB. We can now better model our system and select an appropriate dichroic. Using SearchLight, you can select one dichroic to test in your system instead of purchasing a handful of different dichroics and spending your time in the lab testing all of them.
Suppose you do not have any filters in your lab, or you would like set suggestions. We can select “find compatible products” and search for a filter set. You can bring a set into the session by clicking on the arrow. Let’s consider which filter set may be the optimal selection for this fluorescence set up using the calculator feature.
Just to save a bit of time, I have set up multiple calculators using the same light source, detector, and fluorophore setup. We can now compare the different sets by looking at the different signals, noise, and SNR. You can now look through the different sets and compare their performance. If you would like the brightest signal and darkest background, this calculator shows our premium Avant filter set provides high signal and dark background. If your system does not need the premium performance, we see LED-YFP-A has a very roughly similar brightness with just a bit more excitation light noise. We can more easily compare the sets by normalizing the calculators by clicking on the “normalize other calculators” checkbox. Once we’ve chosen the set we like, we can go directly to the product webpage using the “view on IDEX Health & Science” feature.
Now suppose your light source or detector are not in SearchLight. You can upload the response using a tab delimited file and the “my data” feature to bring your custom data into the SearchLight session. You may then use the data in your calculators. Or suppose you would like to model a bandpass filter or a LWP filter or dichroic, you can easily model using our modeling function.
Suppose your system has your catalog bandpass filter at a non-normal angle of incidence or non-zero CHA. You can model these factors using MyLight, which uses the actual coating recipe we use to manufacture the catalog filter. You can also simulate different polarizations, which is helpful for dichroics!
Testing and optimizing with SearchLight saves you from painstakingly validating different filter combinations in the lab, freeing up your time for other endeavors. We’ve now covered how to optimize a single channel setup by finding compatible filters and using the calculators to compare different options.
Suppose you have a multi-channel system, or you are using more than one fluorophore in your setup. Let’s look at an example for a Cy3 and Cy5 fluorescence setup to demonstrate how to calculate bleed-through. In this SearchLight session, I have prepopulated the Cy3 and Cy5 fluorophores, the light source (the dotted black line), and the detector (the dotted yellow-orange line). I also selected a filter setup for consideration. We can calculate bleed-through using the System Calculators.
The calculators for the fluorophores in their respective channels are below the plot. The desired Cy3 signal and the desired Cy5 signal are in two different calculators. To calculate the bleed-through, one calculator shows how much Cy5 signal will be present in the Cy3 channel. To do this, select the exact same filters as the Cy3 calculator but replaced the fluorophore with Cy5. There is a similar calculator for Cy3. In this case, we see bleed-through is minimal for both channels. Use the normalize feature to make analysis easier.
Extrapolating to other systems, you can create a SearchLight calculator for each fluorophore and each channel to compare the desired signal and calculate the bleed-through.
You can save your SearchLight session for later analysis or share the session with your colleagues and collaborators using a generated link. The “Export” feature downloads all the calculators you have generated in a CSV format. “Print” creates a PDF of your session.
Visit our website for tutorials on additional SearchLight capabilities, select “ Help” on the SearchLight page. If your favorite fluorophore, light source, or detector is missing from SearchLight, please reach out and we may add it to our library.
At times, there isn’t quite the filter you are looking for in our catalog, or you know you want a custom filter for your system, so you need custom specifications. Custom filters tailor the optical response to your system, and you only pay for the optical response you need. You can use our catalog filters to experiment with filter spectral responses to assist in determining custom specifications. Let’s explore ways to manipulate the filters or combine them to discover optical specifications your system needs while also considering filter cost drivers.
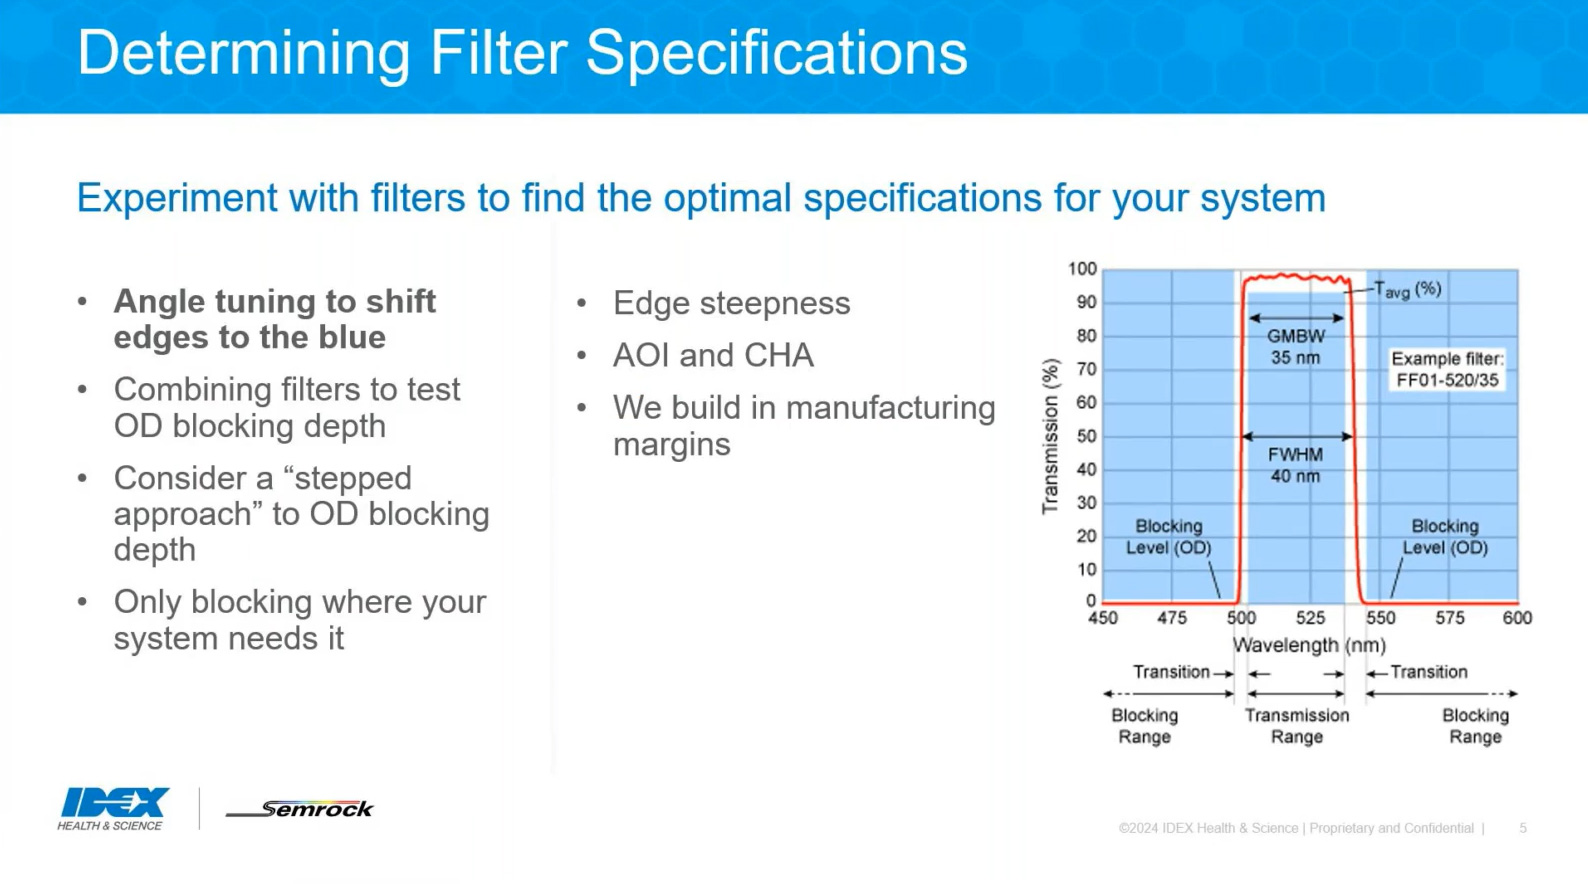
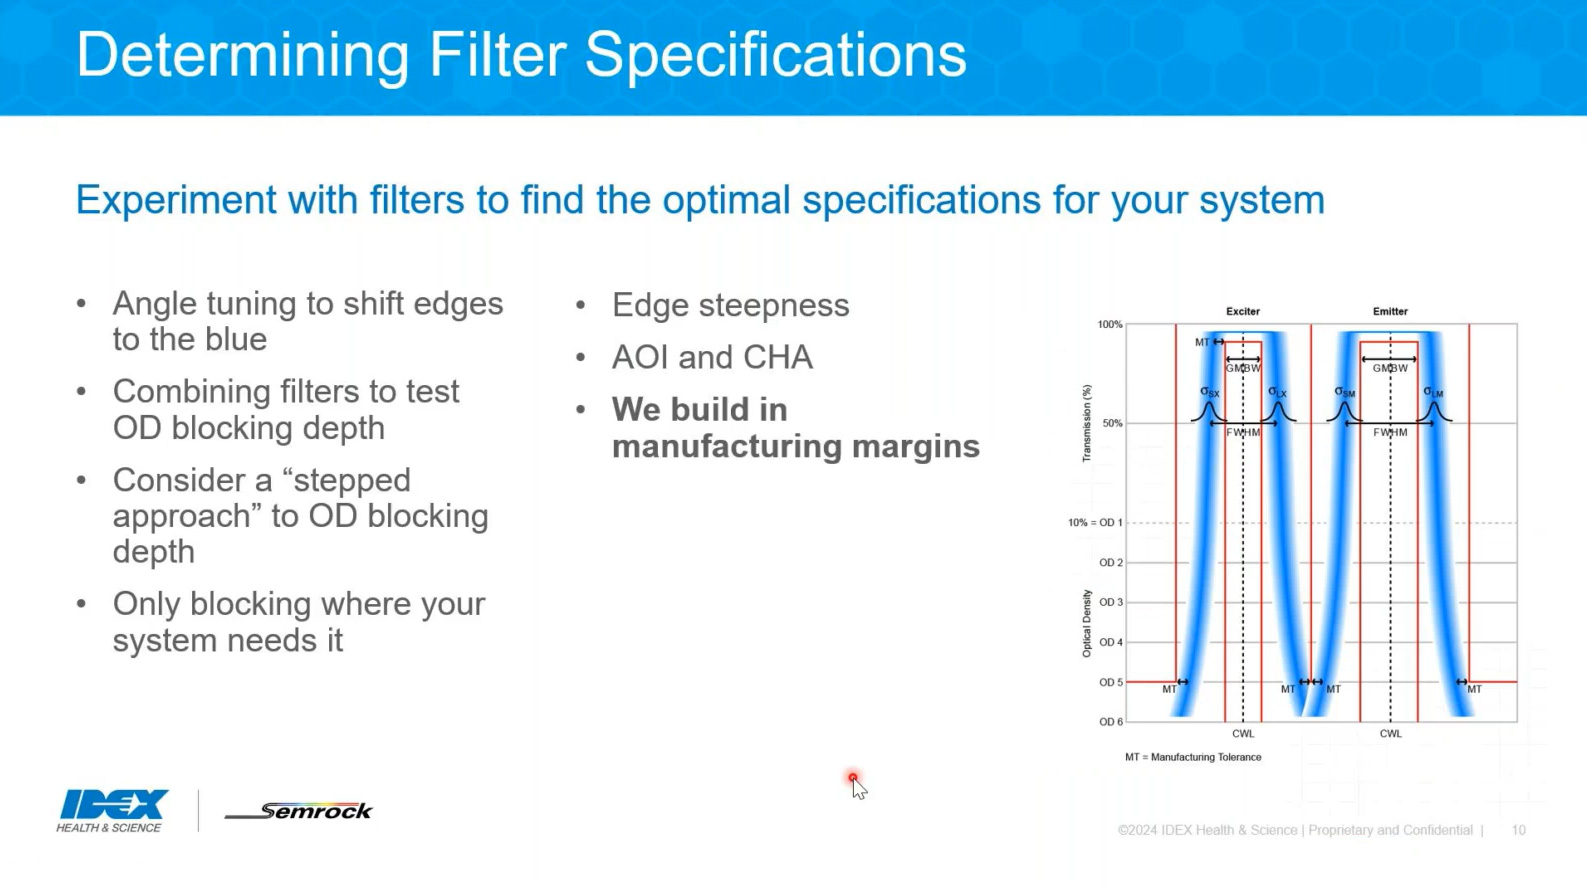
It is likely you have a general idea of the passband region you would like for your system, but perhaps you’d like to fine tune it. You can combine a SWP pass filter with a LWP filter to create edges to determine the passband you may need by building your own bandpass filter. You can also create a passband using two different bandpass filters to create a smaller passband. Angle tuning is a great way to test the location of an edge and if there may be a benefit to shifting the passband to the blue. Remember, you can model angle tuning using SearchLight. By angle tuning or combining filters, you can determine the center wavelength and bandpass region
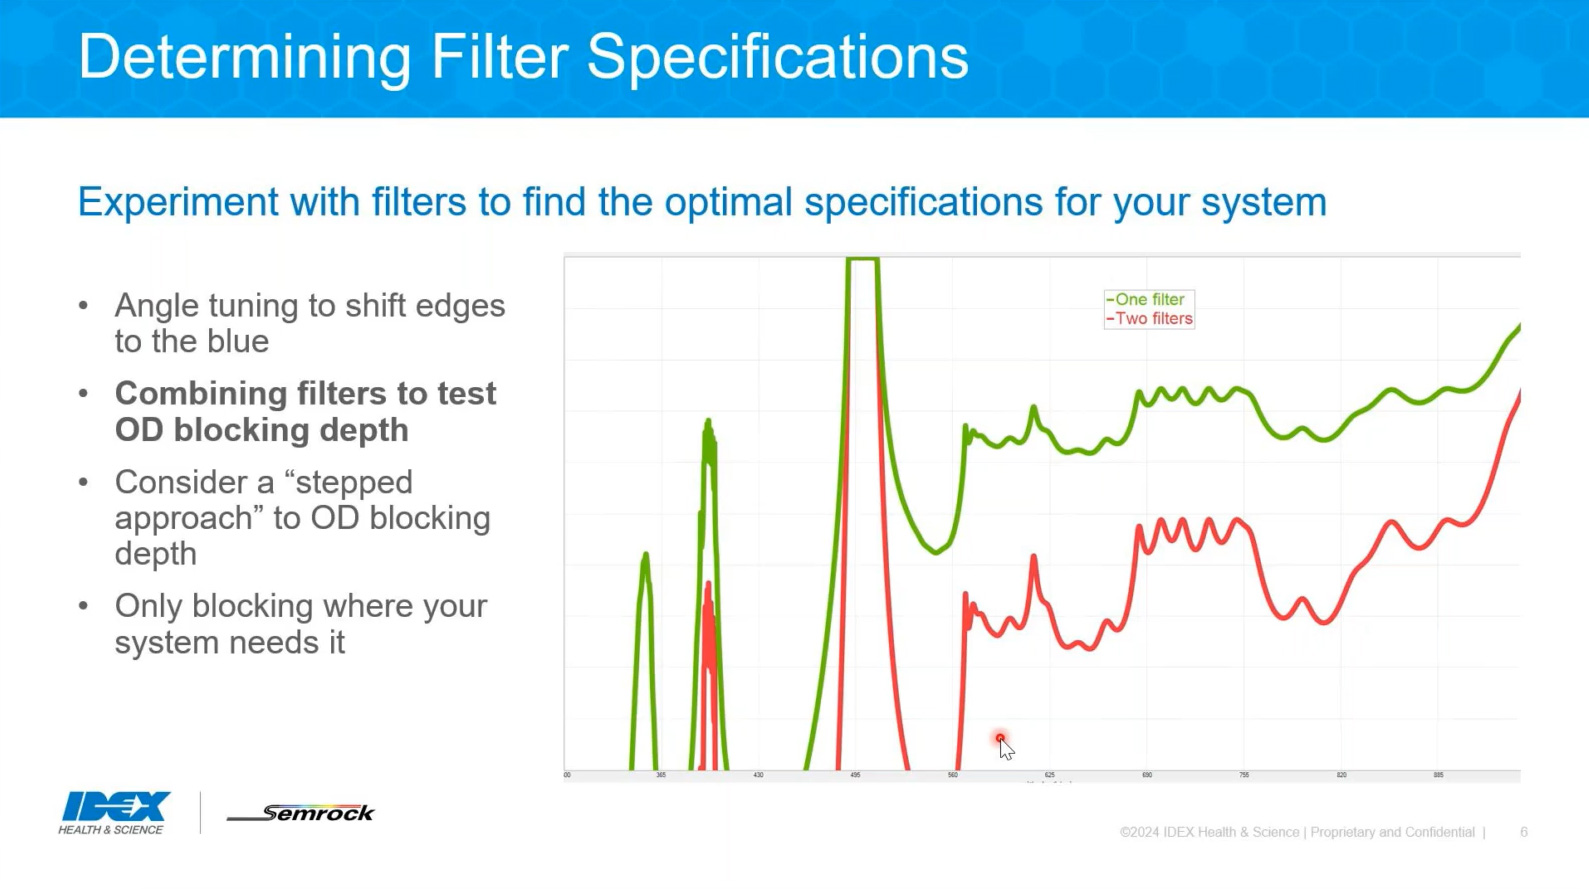
There are many ways to test what depth of blocking your system needs. For example, combining two or more copies of a filter can demonstrate the need for deeper blocking than one filter provides, as the OD graph shows. We also have different levels of OD blocking across different families of filters. Our Nanopede™ filter family has essential OD blocking of OD5. Our BrightLine filter family has a variety of different levels of blocking; just look at the filter specifications on each filter page. You can combine different depths of OD blocking to see what your system may need.
Rarely is the deepest blocking required across the entire spectral range. One can consider different levels of blocking in a stepped approach such that the deepest blocking is near the passbands while the blocking decreases outside of this range. Tailoring the depth of blocking to your detector responsivity means you do not pay for OD blocking you do not need.
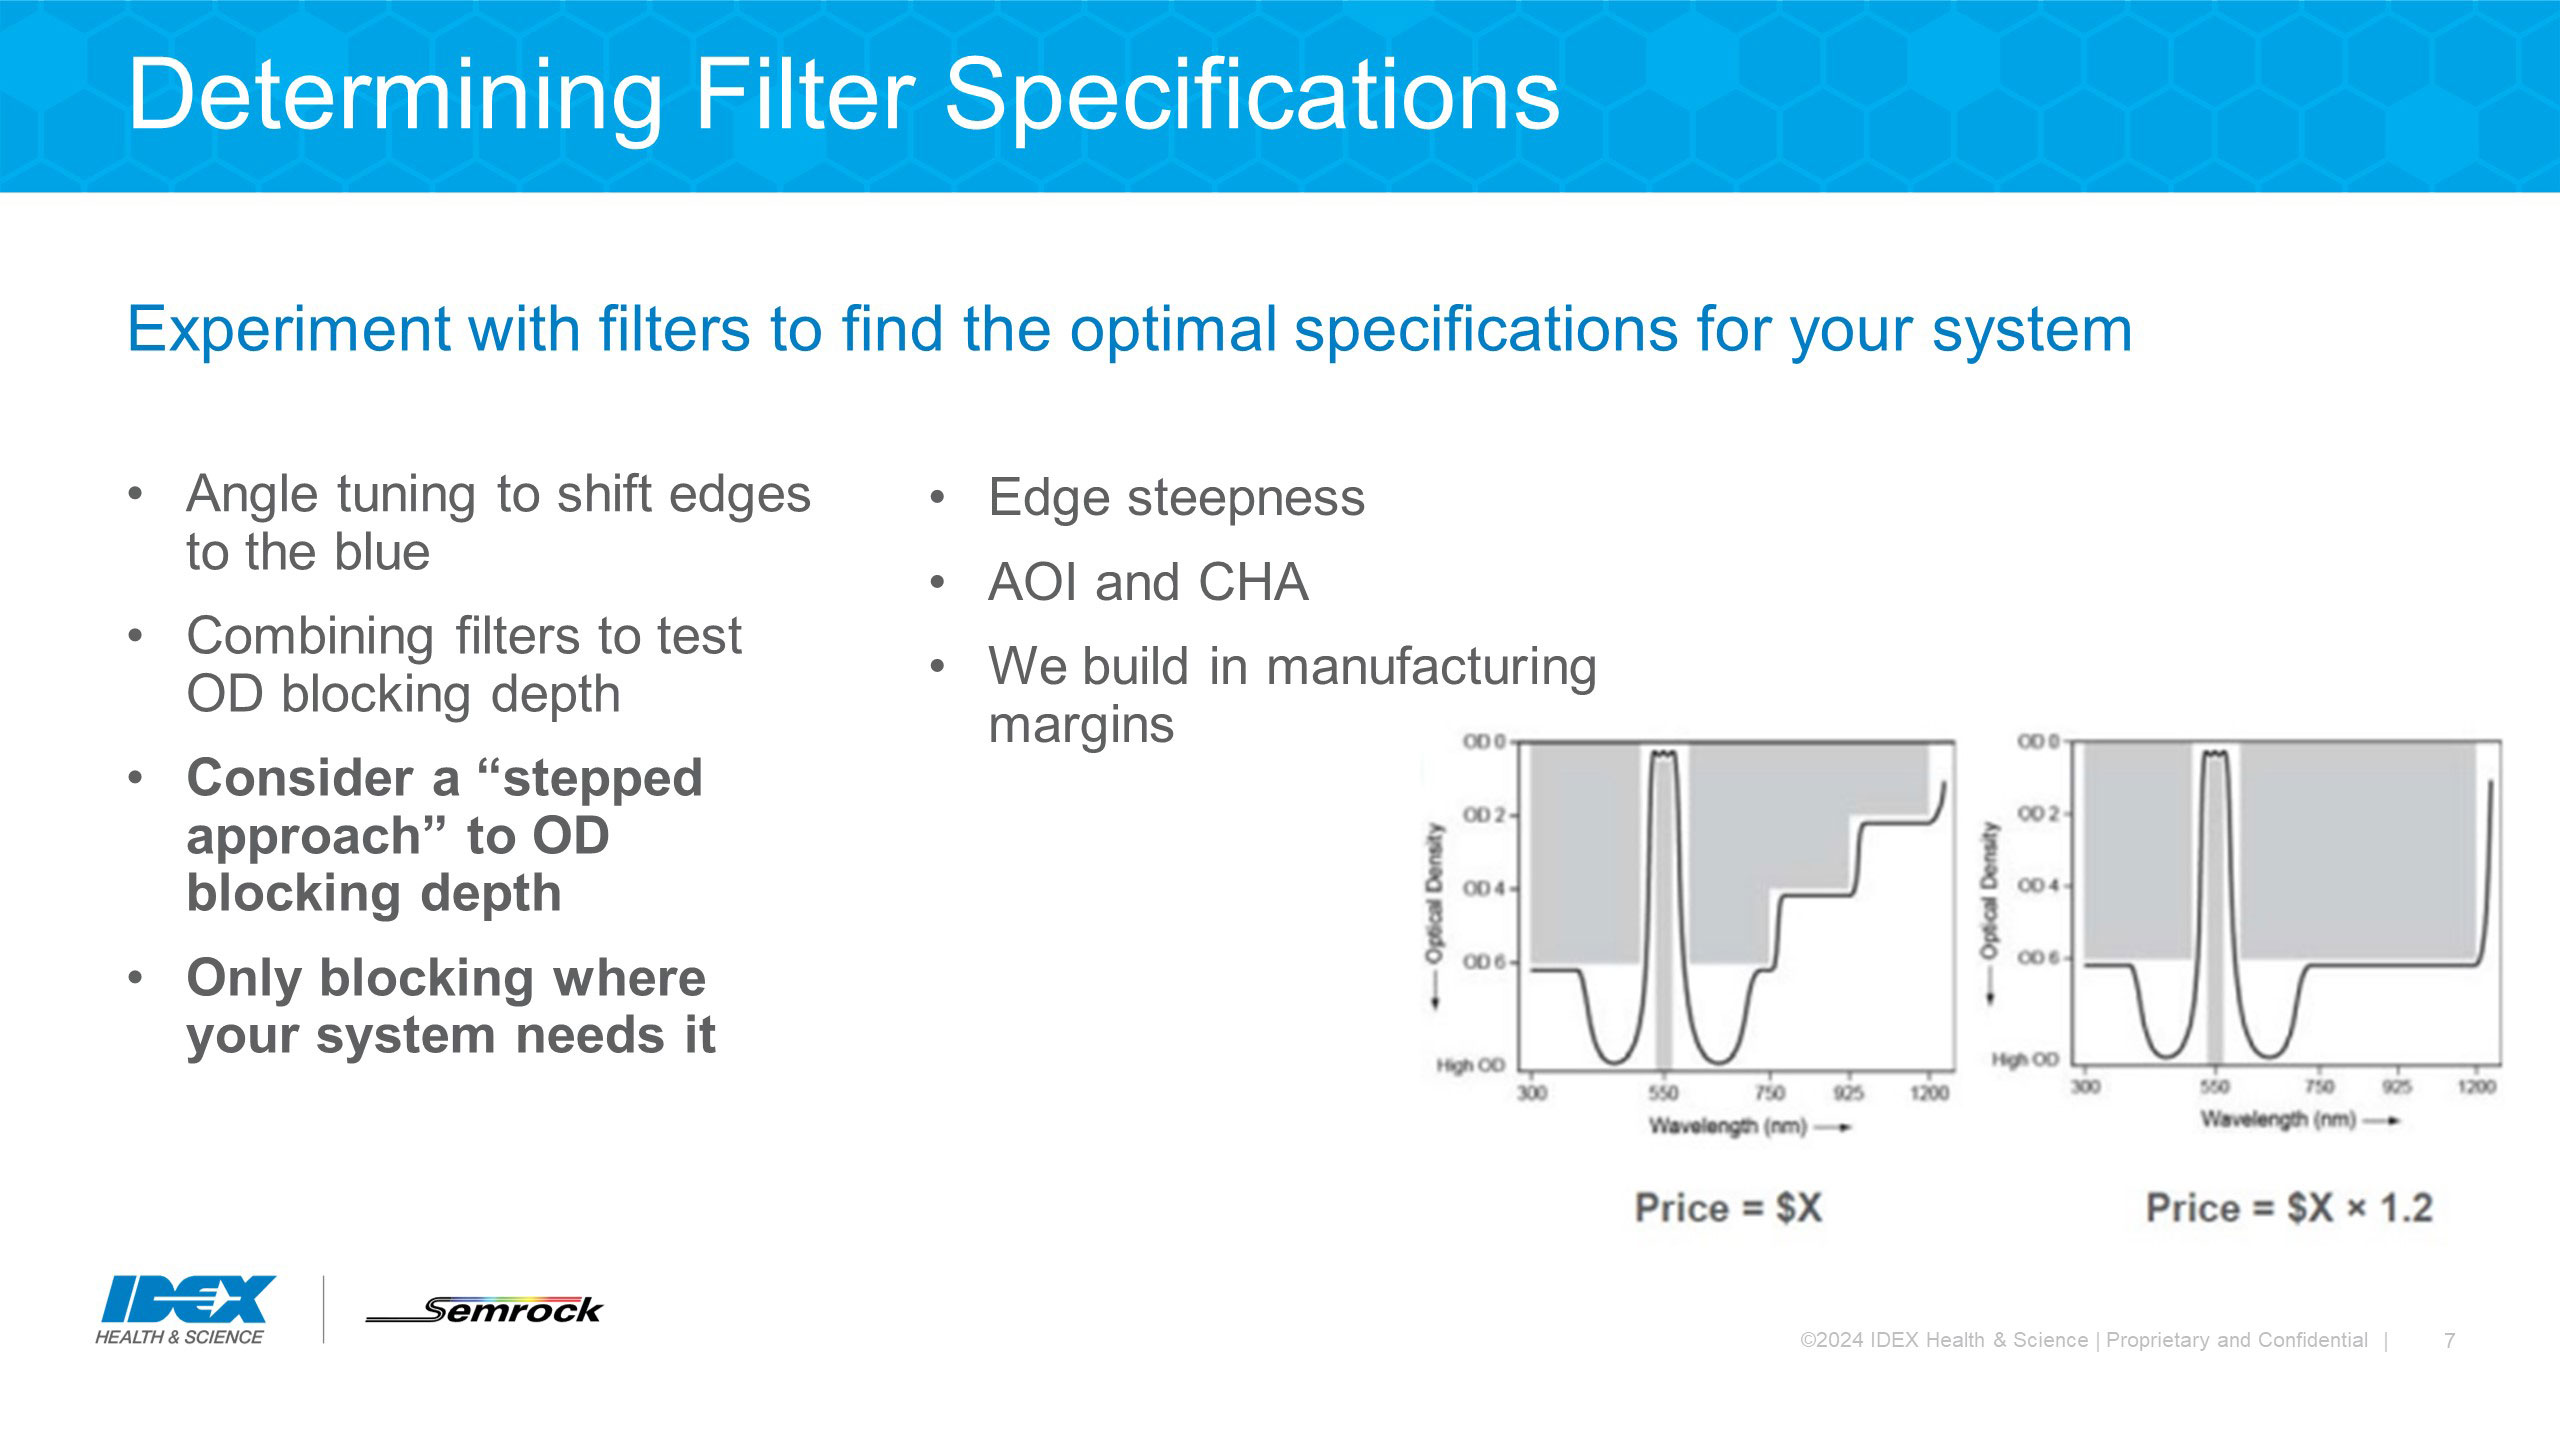
In addition to depth of blocking, one must consider the range of blocking. What is the responsivity of your detector? Photomultiplier tubes and some photoavalanche diodes have extremely low responsivity in the near IR and IR, so you may not need much blocking, if at all. Nowadays, many cameras have an IR filter built into the assembly, which demonstrates another situation where careful consideration of detector responsivity can save you money. You can also consider your light source and tailor your OD breadth to match it.
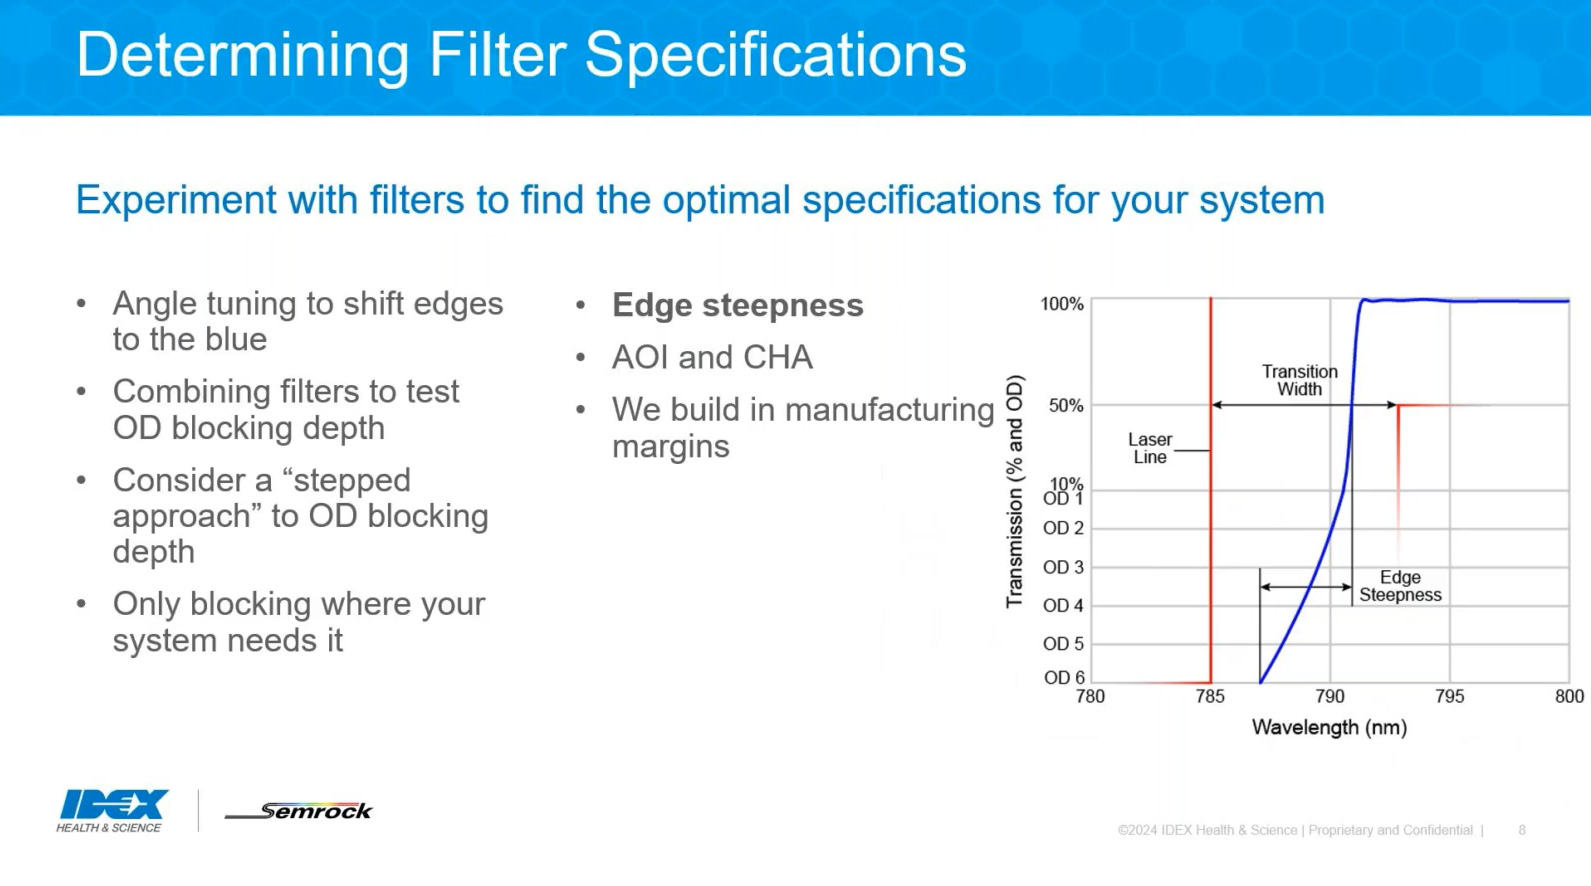
Edge steepness is the transition from OD6 blocking to transmission, with a steeper edge indicating a narrower transition in wavelength space. We have varying levels of edge steepness amongst our catalog filters. Our steepest edge is the LWP Verona™ family, which transitions from blocking to transmission in approximately 1 nm, depending on edge wavelength. We have other LWP filters with less steep edges. Similarly, we have dichroics with varying levels of steepness. In general, a steeper edge is a higher cost driver, so optimizing for the right steepness is key. You can compare different steepness levels using SearchLight as your guide.
Let’s look at one interesting scenario. Sometimes you determine a set of specifications for one channel in the system, such as edge transition width and look to translate the specifications to other channels. Suppose you determine specifications for a blue channel and would like to translate those specifications to the red channel. It is important to consider relative changes instead of absolute. Perhaps you have determined how narrow the transition from blocking to transmission should be. An 8 nm transition at 415 nm has a reasonable edge steepness of 1.5%. The same 8 nm transition at 750 nm has a much steeper, and thus much more expensive, edge steepness of 1%. 8 nm represents an absolute shifting of the specification. If instead you choose to match the 1.5% edge steepness at 750 nm, the transition is ~12 nm, and the edge steepness cost driver remains the same for both filters. It is strongly recommended to use relative changes, which is a percentage of the target wavelength.
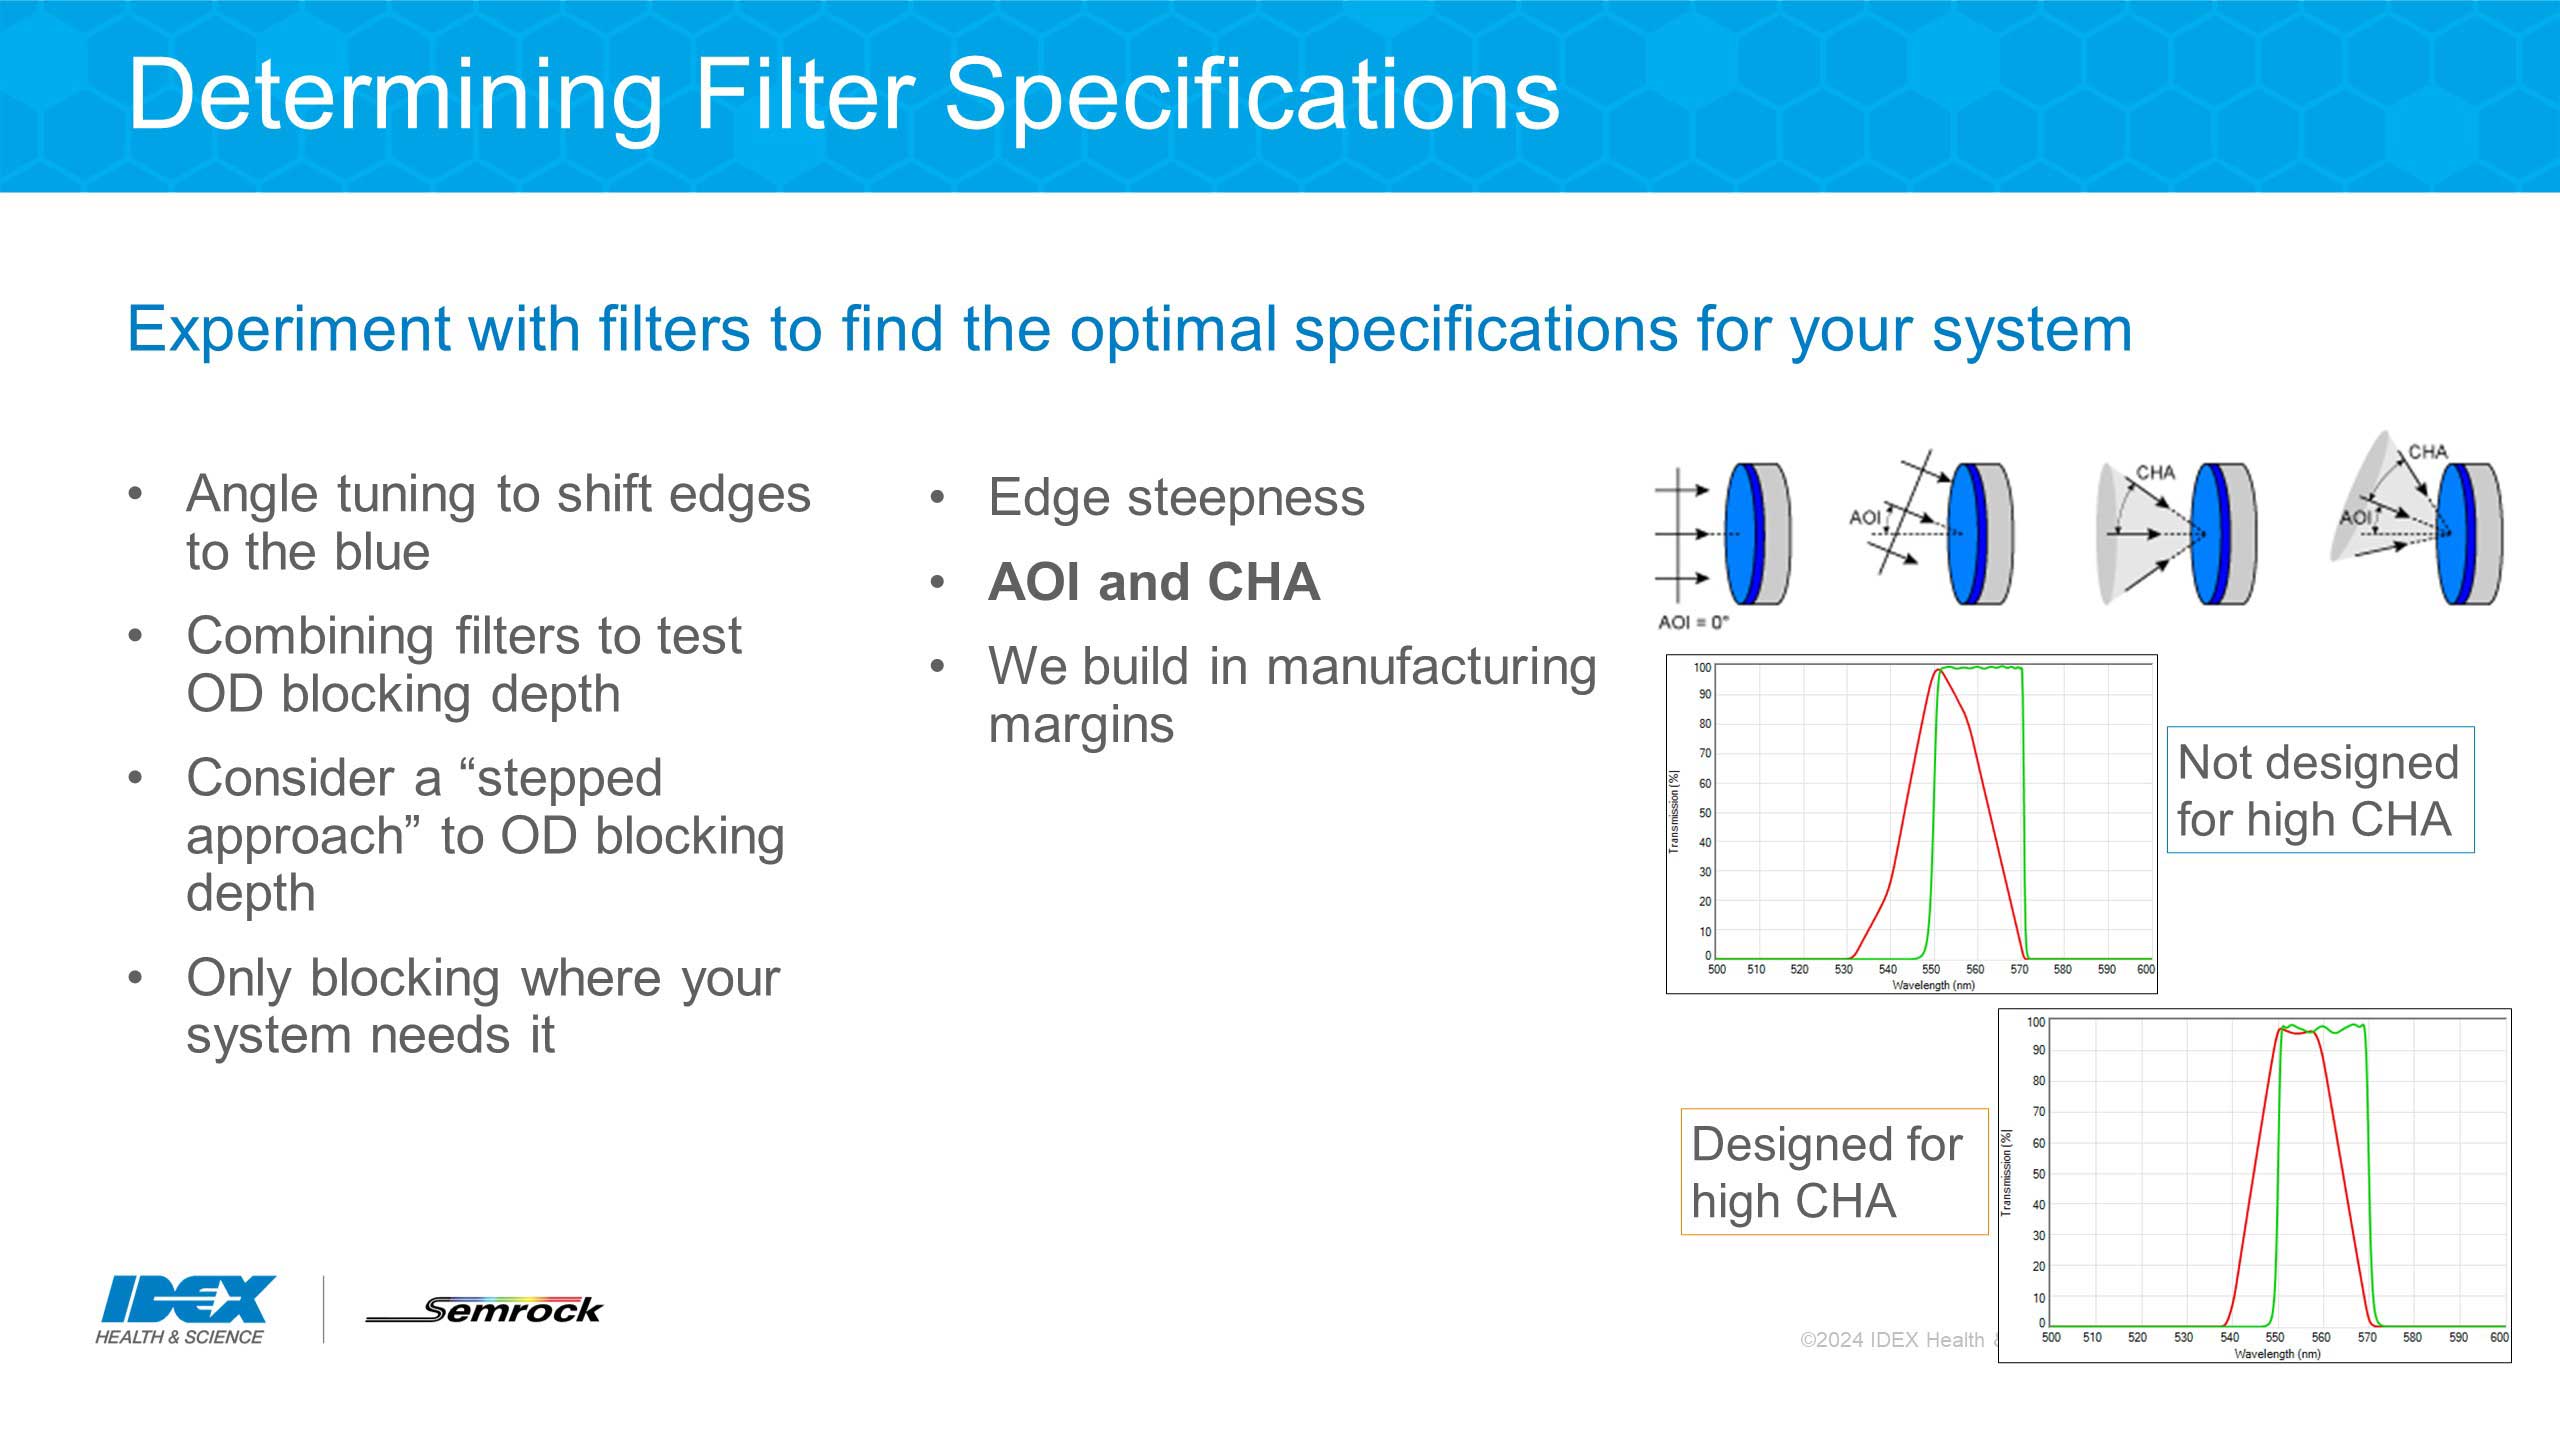
You may be familiar with optical system modeling and ways to determine the field angles for your system. Careful consideration of your AOI and CHA are paramount to filter design. While AOI shifts an edge to the blue as it increases, CHA relaxes the edge as it averages over all the AOIs in the filter response. Semrock can design for each of these effects such that transmission is high, and the edges maintain the desired steepness, as in this example.
We have over 20 years of experience making hard-coated optical filters, so we know what to expect from our manufacturing processes. Semrock uses manufacturing specifications, which means the specifications on our drawings and spec sheets are the specifications your manufactured filter will have. Manufacturing margin is how much a filter edge shifts around in wavelength space due to natural variations in the manufacturing processes. We build in manufacturing margins to our designs. In other words, it is not just the theoretical response that meets the specifications but the actual coated filter. Our manufacturing margins are industry leading, and some consider them the gold standard.
We have covered how to model in SearchLight and how to test specifications and think about specifications during prototyping. Let’s talk about partnering with our team!
We are the specification experts. We work through specification choices and tradeoffs with you as you prototype so you can meet your system performance needs and your filter bill of material (BOM). In our partnership, we can determine which specifications are key to your setup. As an example, if you need the highest signal, we would recommend our precise edge placement ability. Using our state-of-the-art techniques, we can reduce the manufacturing margin such that the variability run-to-run is even better than our gold standard manufacturing margin.
We also pride ourselves in the repeatability of our manufacturing processes. As you can see in this graph, our filters are the same run-to-run, year-to-year, even facility to facility.
We have the measurement capabilities to prove we meet or exceed our manufacturing specifications. We use our flagship spectral measurement system, the Peregrine, to measure down to OD6. But that didn’t measure deep enough OD blocking for us, so we developed the proprietary KolaDeep spectral measurement system, which can measure down to OD9, 10, even 11. KolaDeep can also resolve steep edges, so we can prove tight transitions and extreme edge steepness to match your specifications.
Our collaboration also determines which manufacturing line your filters should follow based on your production level demands. This means the filters you use for prototyping use the exact same manufacturing process as your production filters.
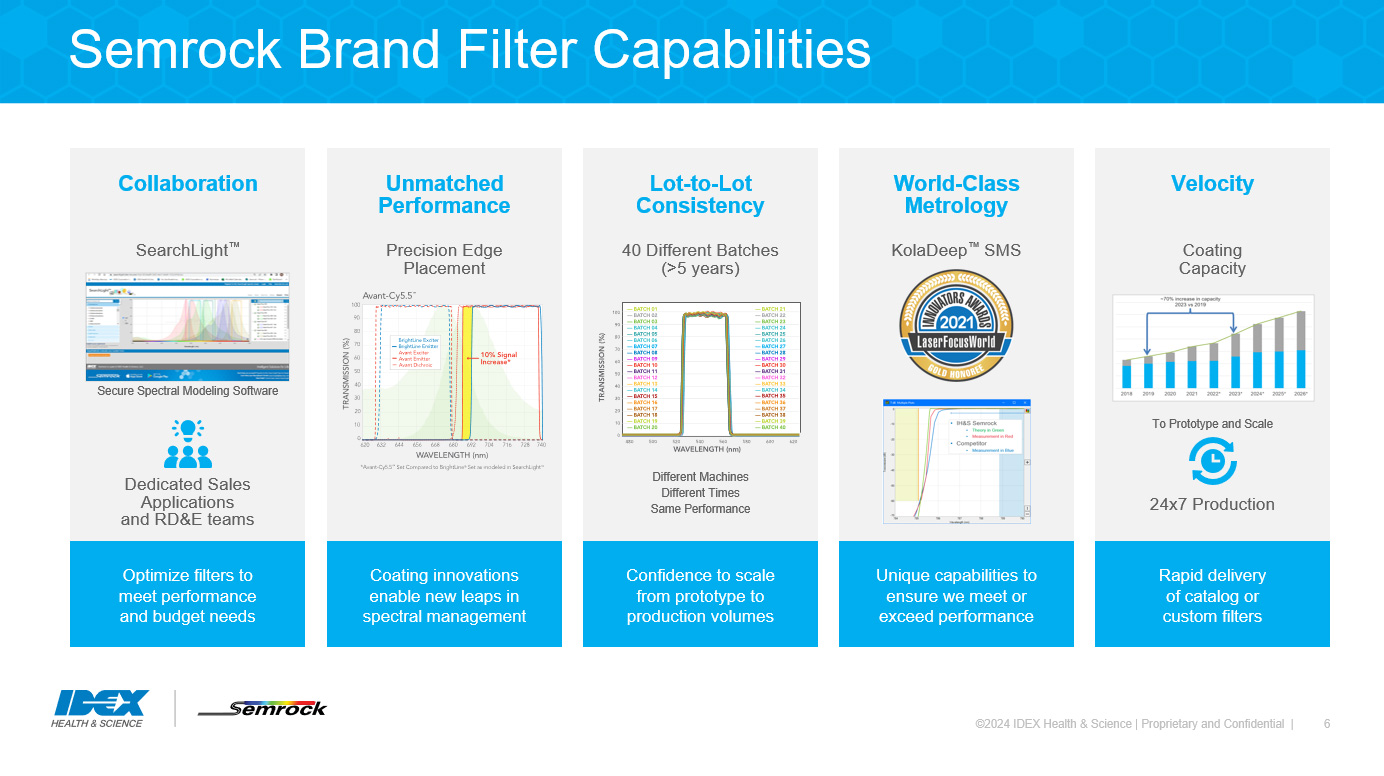
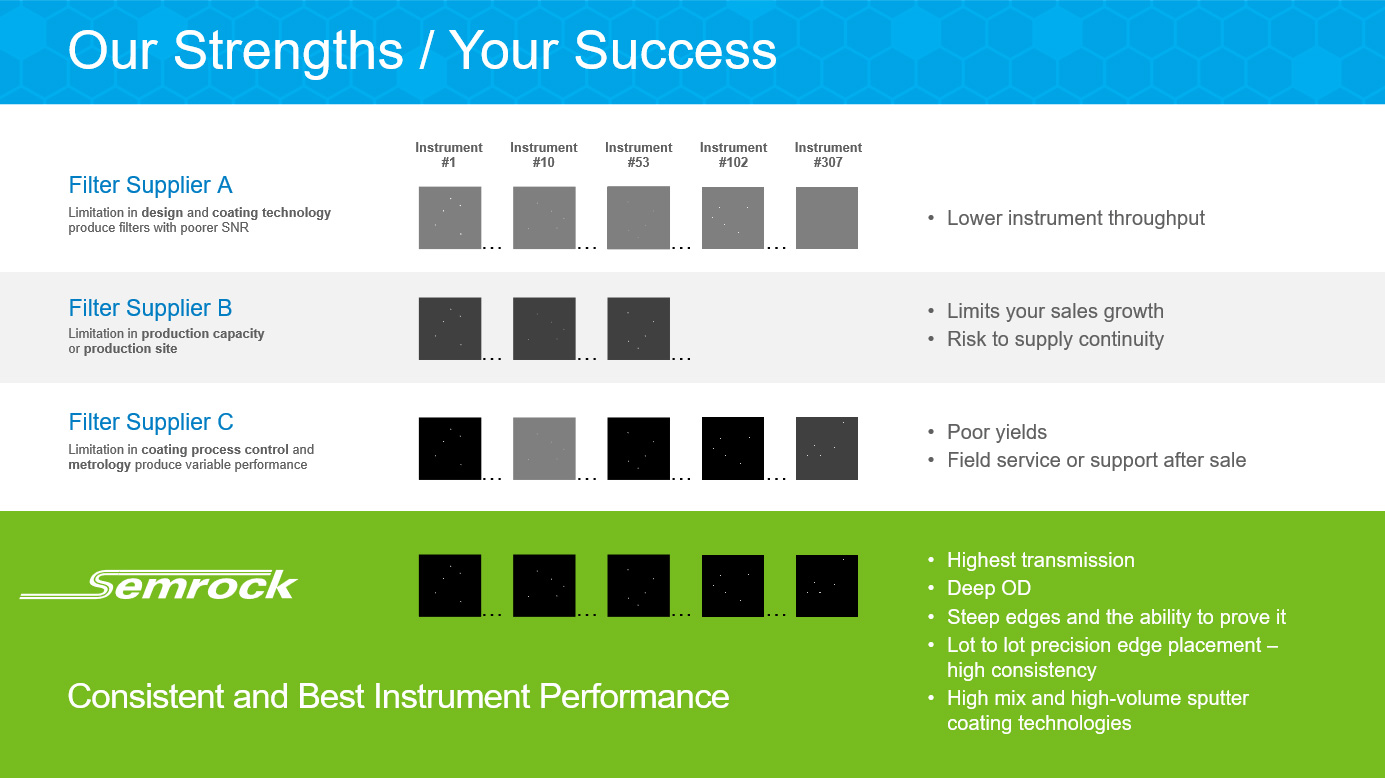
Finally, use our strengths to bring your system to the market rapidly. We have high transmission, deep blocking, and steep edges, and we prove it. This means your system performs as you expect. With lot-to-lot consistency and precise edge placement, we ensure a filter’s critical edge is consistent throughout all your systems, ensuring results across your instruments are reliable and comparable. We have two coating technologies to meet your production level demand, which ensures supply continuity and continued sales growth.
In addition to all these great reasons to partner, we have a return policy and industry leading warranty. Our standard sized catalog filters have a 30-day return policy, meaning if the filter doesn’t work for you, you can return it, so you do not waste your R&D budget on filters you don’t need. We also have ten-year warranty on all filters. We stand behind our products and their performance, empowering you to stand behind your instruments and their performance.