Understanding and Testing Fluid Flow for Custom Valve Design
Overview
Solutions to Your Challenges
IDEX Health & Science has a team of Engineers, Scientists, Technicians, and industry experts to support your product development needs. Our technical team deploys a wide array of tools, combined with many years of experience, to provide partnership in solving your fluidic challenges. These tools include FMEA, CFD, FEA, DFX, Tolerance Analysis, DOE, and Weibull-based lifetime demonstration testing.
Rotary Shear Valve Design
There are many factors taken into consideration during the development of a valve design. Prototyping the complex geometries of valve stators can be expensive and time-consuming but with the use of simulation tools, we can iterate multiple designs quickly and select the most desirable solutions before the first parts are manufactured.
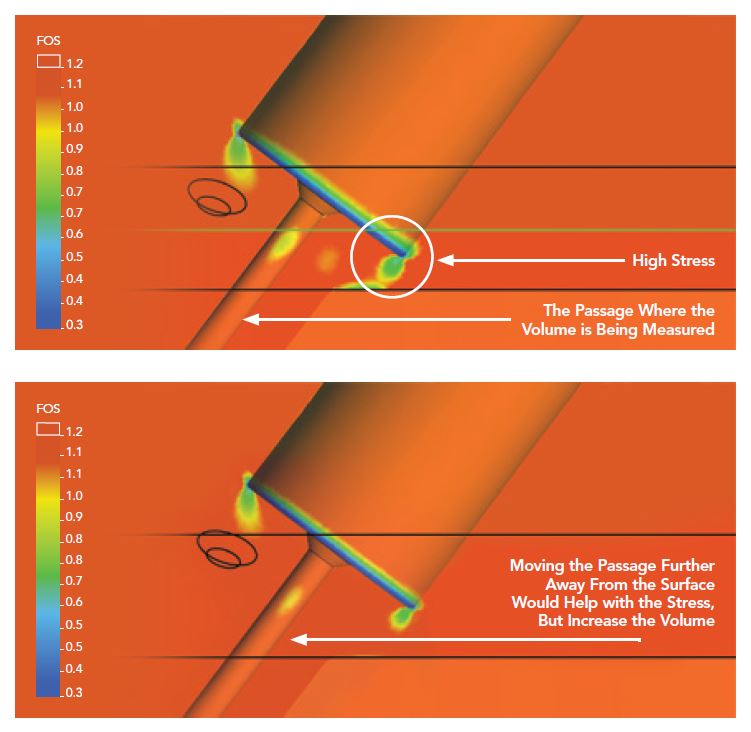
Figure 1: Factor of safety of face seal at 20,000 psi.
The Mechanics of Shear Valve Design
A typical consideration in valve design is port-to-port volume. The geometry of a valve stator is such that minimizing port-to-port volume is not a function of simply shortening the fluid passages. To do so brings the fitting port closer to the stator surface that has secondary effects. Specifically, it can result in areas of higher stress and deflection, impacting the performance of the valve (see Figure 1).
Using simulation tools, IDEX Health & Science will evaluate design options to seek the best balance between port-to-port volume and mechanical stresses. The use of these simulation tools allows for rapid iteration of designs and allows the development of geometry that shows virtually no risk of unexpected failures from stress.
Understanding Fluid Flow in Shear Valve Design
Understanding fluid flow in shear valves is vital to valve design and system performance. Poor flow in valves can contribute to degraded chromatography and poor system performance. IDEX Health & Science uses Computational Fluid Dynamics (CFD) simulations to evaluate and optimize valve designs virtually. CFD can characterize fluid flow and identify less optimal designs before any critical parts are manufactured, avoiding unnecessary time and expense. CFD simulations help ensure that any misalignment arising from inaccuracy of the valve driver and manufacturing tolerances are understood and will not negatively impact the chromatography or performance of the instrument. Understanding the specifics of flow through the valve becomes increasingly important as passage sizes in the valves get smaller.
In some instances, fluidic simulation tools are used to calculate port-to-port pressure drop in a valve. For example, it was found that the pressure drop across a pump valve was negligible at nano flow rates and remained negligible at flows as high as 3.0 mL / min (reference Figure 2 for simulation results at 300 nL/min, 2,000).
Another example of where CFD analysis can be an effective tool is to use it to understand how misalignment in shear valve fluidic components changes fluid flow. Misalignment in flow passages becomes more important the smaller the passages.
We have the CFD tools to evaluate and optimize this alignment of small passage sizes to deliver high-value, superior designs on schedule.
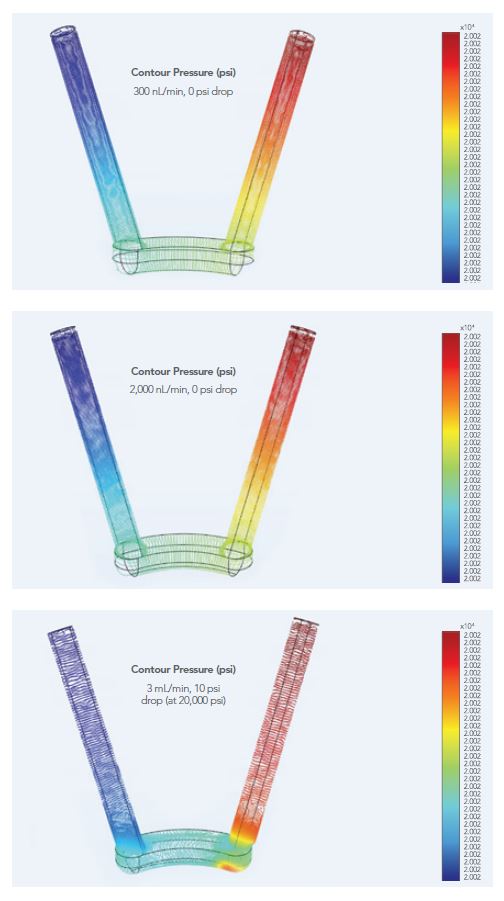
Figure 2: Pressure drops at 300 nL/min, 2,000 nL/min, and 3.0 mL/ min.
We prepared the following examples of streamlines and slice velocity plots. Simulations were run with nominal (perfect) alignment, 0.002” (0.05 mm) misalignment, and 0.005” (0.13 mm) misalignment at flow rates of 300 nL / min, 2,000 nL / min, and 3.0 mL / min (refer to Figures 3, 4, and 5 below).
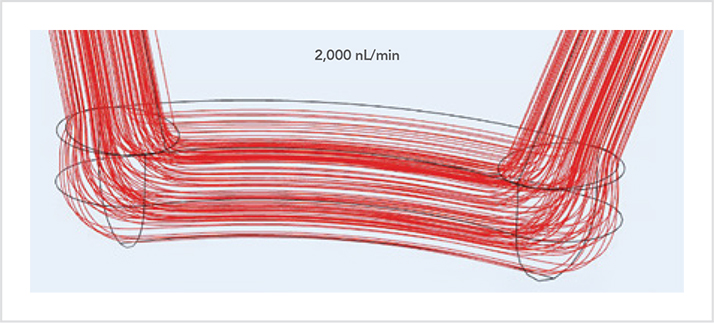
Figure 3: Streamlines with nominal alignment.
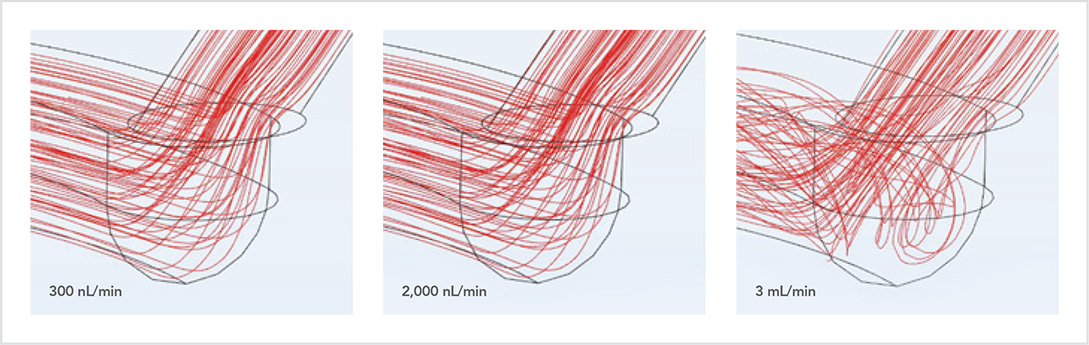
Figure 4: Streamlines at 0.002” (0.05 mm) misalignment.
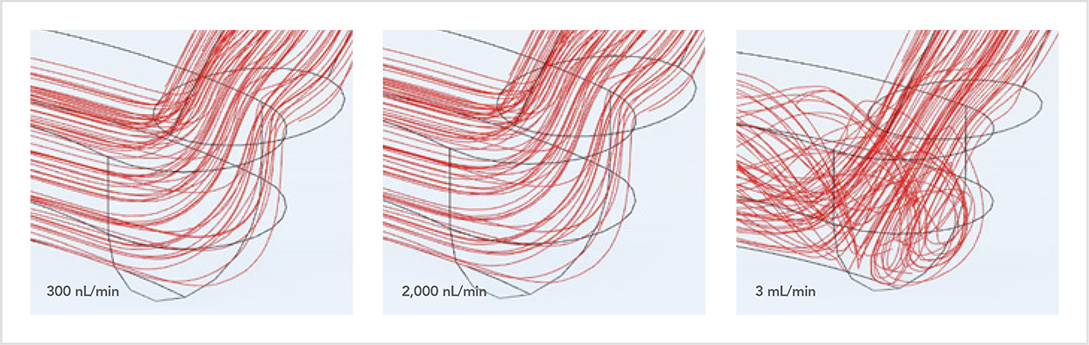
Figure 5: Streamlines at 0.005” (0.13 mm) misalignment.
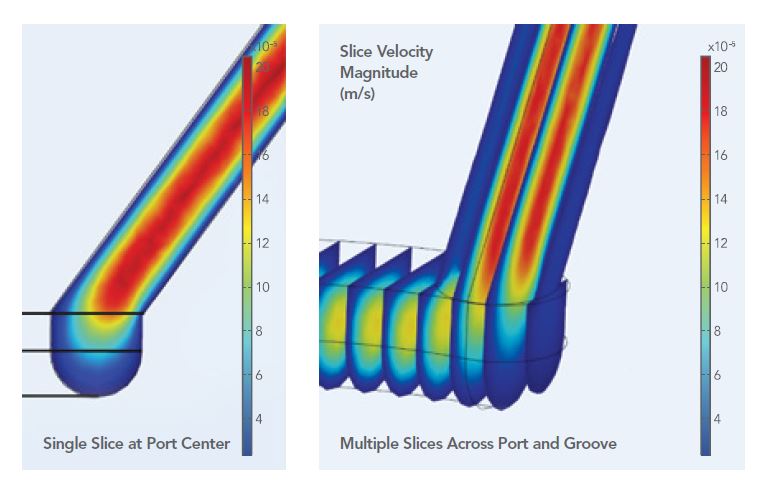
Figure 6: Nominally aligned port at 300 nL/min.
As can be seen from these simulations, turbulence in the flow can arise from sufficiently large misalignments and flow rates, supporting the need to optimize valve designs to maintain as smooth a flow as possible to reduce unwanted analyte diffusion and mixing, which can reduce chromatographic quality.
Fluid flow velocity can also be visualized using CFD. Fluid velocities will change when methods requiring different flow rates are run. Additionally, local velocities in the valve will differ for different passage sizes and different degrees of misalignment. Figure 6 shows an example of a slice plot of fluid velocities for a pump valve design. Visualization helps confirm changes from laminar to turbulent flow inside of the valve. This flow visualization reduces design-build-test iterations and the risk of unexpected chromatography results from valve flow disruptions. Figure 6 shows laminar flow in the pump valve at 300 nL/min with low flow velocity near walls and bulk flow in the passage center.
Physical characterization of valve components is another critical piece of understanding performance. The IDEX Health & Science valve Life Test Laboratory contains analysis equipment that helps our Development Engineers investigate designs and evaluate performance during reliability testing. Looking closely at the surface of sealing faces can lead to better insight into the workings of the design and help assess performance.
IDEX Health & Science has sophisticated in-house equipment to analyze surfaces including digital optical microscopes, a white-light interferometric-based optical profilometer, and a Scanning Electron Microscope (SEM). Additionally, IDEX Health & Science partners with certified outside laboratories for even more advanced analyses including Tunneling Electron Microscopy (TEM) and Focused Ion Beam Milling (FIB). Figure 7 below shows a simple example of surface analysis using optical microscopy and optical profilometry. In this example, the same defect (a light scratch running near vertically in the images) can be seen in both techniques and can be quantified with the optical profilometer.
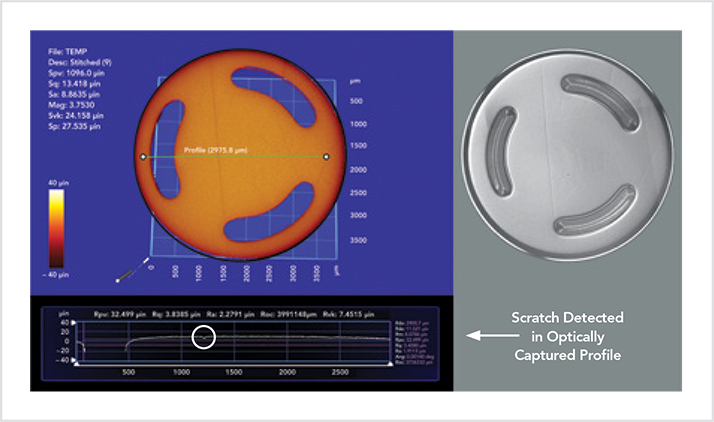
Figure 7: Surface analysis of valve rotor seal with optical profilometer and microscope.
Summary
In summary, by leveraging computer simulation and analysis equipment IDEX Health & Science can:
- Reduce iterations and risk of unexpected mechanical failures from stress and deflection along with unwanted chromatography results from valve flow disruptions.
- Evaluate valve components to understand the impact of seal wear.
- Balance cost, delivery, and design for optimized flow path alignment and tolerancing with special attention paid to fluid flow impact.
- Partner with us for the highest value, shortest lead-time design, considering material, design, manufacturability, and reliability.
Authors:
Mike Keller, Dan Czarnecki, Craig Graham, and Audrey Schrock